
Monthly Market Intelligence

Beagl
Barometer™

A logistic-regression–based capacity regime detection model that identifies freight market inflection points before they show up in rates.

How the Barometer Works ↓
July 2026 Reading
27
↑ Deep Tight Regime
Monthly Market Intelligence · Issue No. 16

Capacity Regime
Detection.
Before the Market
Admits It.

The Beagl Barometer is a logistic-regression–based capacity regime detection model designed to identify inflection points in the freight market before they show up in rates. It continuously analyzes market structure and pricing behavior, assigning a normalized reading from 0–100 with a critical trigger value of 50 separating tight and loose capacity regimes.
Current Barometer Reading
27
↑ Deep Tight Regime
0
Very Tight
50
Trigger
100
Very Loose
Regime
Tight ↑
Trend (90d)
Tightening
Prior Month
26 ↓ 1pt looser
01

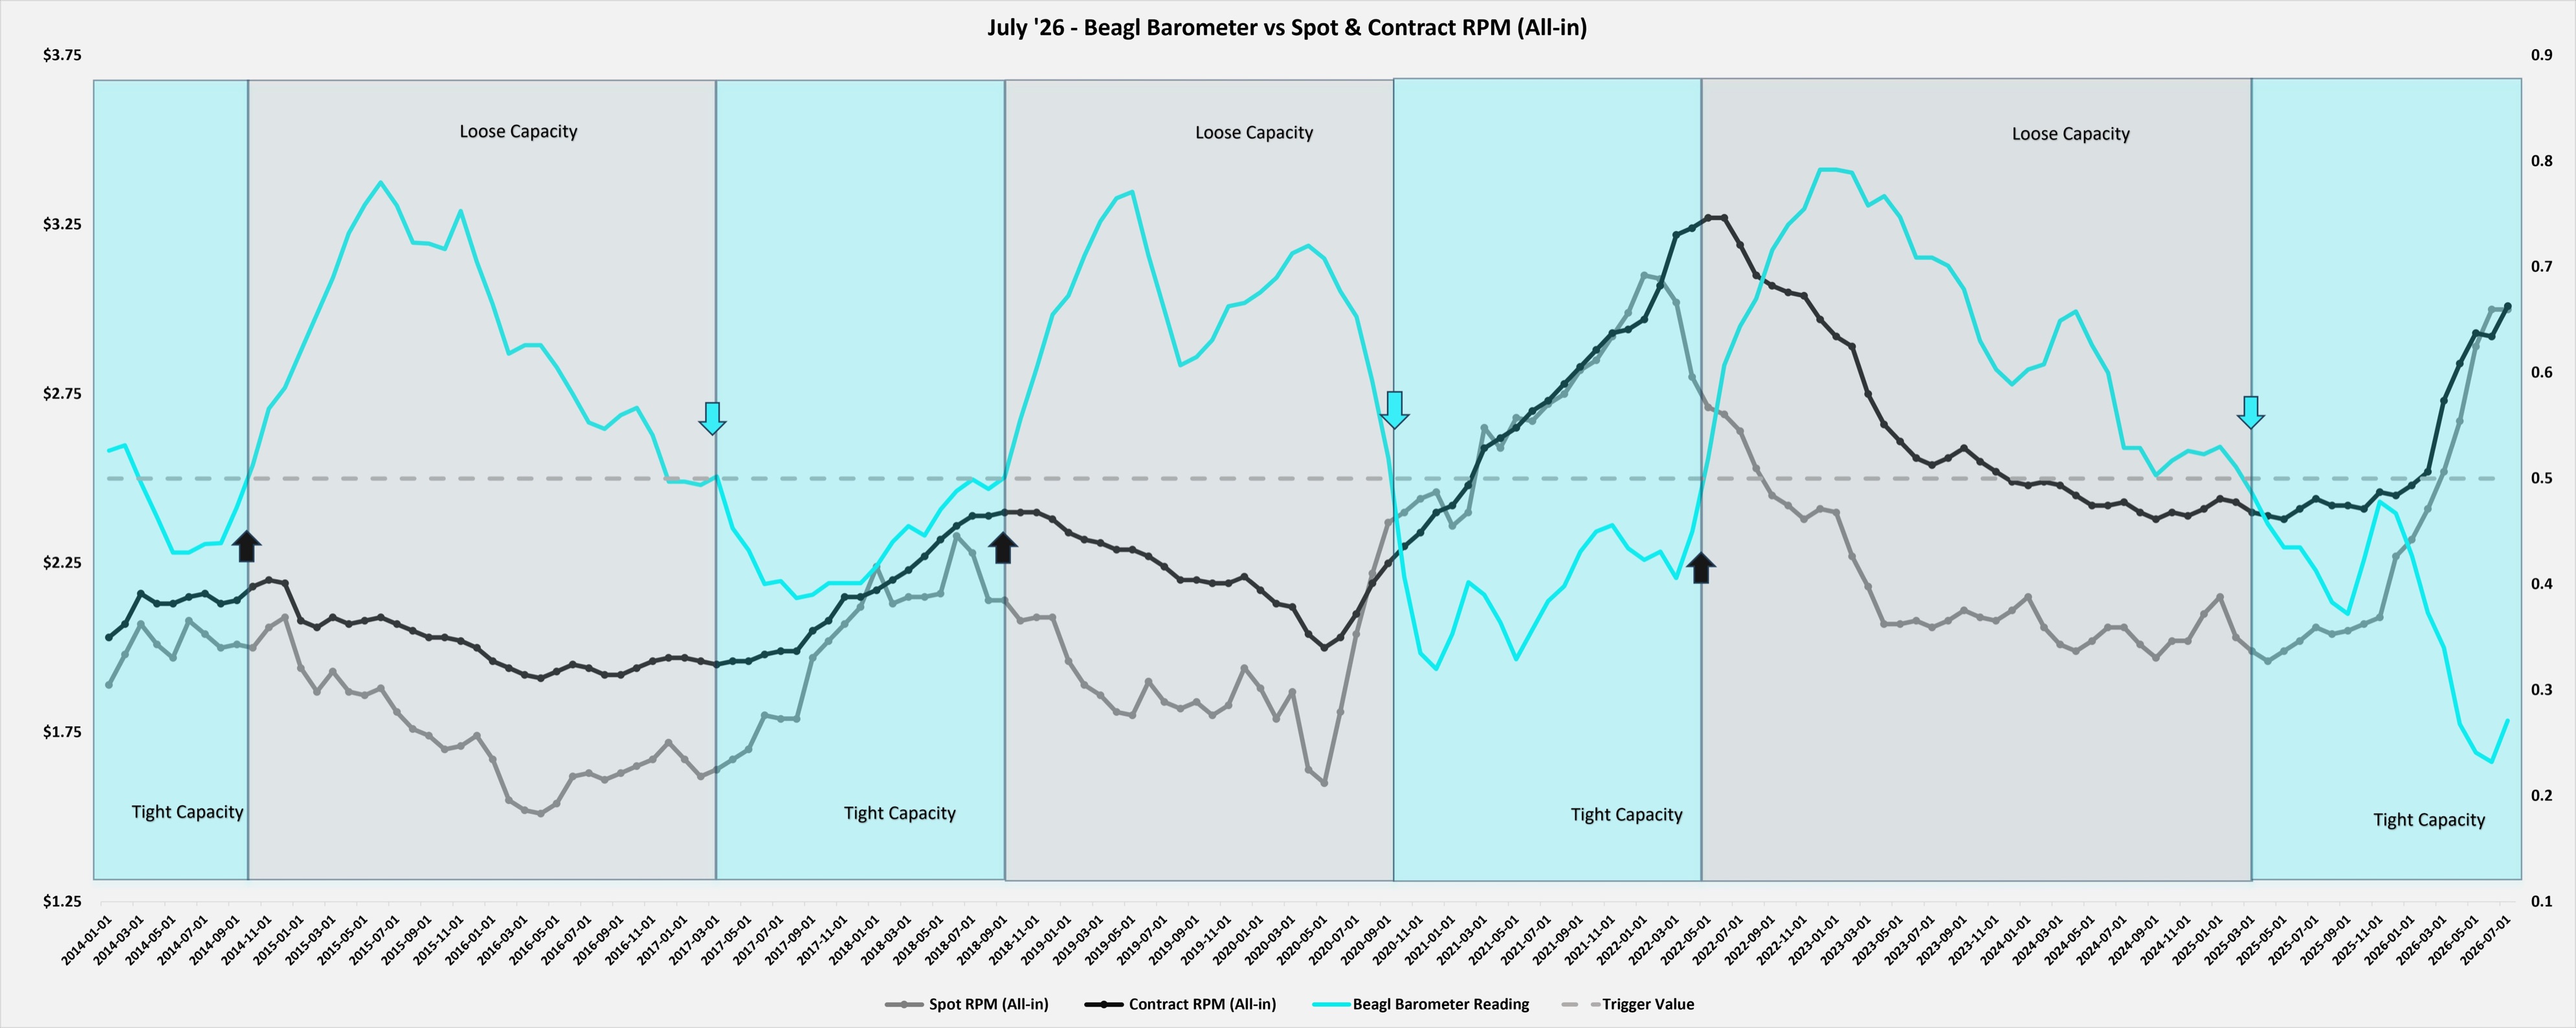
Barometer Chart, July 2026

Beagl Barometer vs Spot & Contract RPM (All-in) · 2014–2026
Beagl Barometer time series, July 2026
02

Current Regime Status

Supply
Tightening
FMCSA Active Registrations and all employees in truck transportation continue to see marginal declines with signs of flattening, though Class 8 net orders have surged as fleets replace ageing equipment.
Demand
Tightening
Merchant wholesaler sales and inventory-to-sales ratios continue to show final demand is strong, while truck tonnage has normalized after the May increase.
Leading Indicators
Tightening
SONAR OTRI holding near cycle highs while ATRI operating costs versus spot rates have loosened as carrier margins improve.
Sub-index
Supply index
TightNeutralLoose
34
Tight
Sub-index
Demand index
TightNeutralLoose
28
Tight
Sub-index
Leading indicators
TightNeutralLoose
30
Tight
03

Component Data Readings

Supply Inputs
All employees, truck transportation Tight
Active FMCSA Class 8 registrations Tight
Class 8 net orders Loose
Demand Inputs
Real personal consumption expenditures Neutral
Industrial production, manufacturing Slightly tight
Merchant wholesaler sales Tight
Inventory to sales ratio Tight
Truck tonnage index Neutral
Leading Indicator Inputs
DAT load to truck ratio Tight
SONAR OTRI Tight
ATRI operating cost vs spot rates Loose
Dry van contract to spot premium Tight
04

Market Interpretation

The Beagl Barometer moved further below its 50-point trigger threshold in July 2026, continuing the tightening trend that began in April of 2025.

Spot rates and contract rates started to normalize with contract rates resetting above spot rates marginally, we expect to continue to see higher contract resets throughout bid season.

Pricing Team Action Items
Shift baseline rate horizons to 30 to 90-day forecasts, respecting seasonality for mini-bids, over 52-week historic averages.
Accelerate contract renewals on high-volume lanes before carrier leverage increases further.
Avoid over-committing to spot awards, tender rejection risk remains elevated.
Use the Barometer reading as an objective anchor in carrier rate negotiations.
Monitor contract resets closely, broker margin compression is accelerating the repricing cycle.
05

How the Barometer Works

01
Structural Balance of Available Capacity
The Barometer measures structural shifts in capacity availability. As available capacity tightens or loosens, rate shifts follow, spot first, then contract. The model detects the capacity move before it appears in pricing.
02
Logistic Regression Output
A logistic regression framework translates multi-factor supply, demand, and leading indicator signals into a normalized 0–100 probability score. The 50-point threshold is statistically derived.
03
Exploiting the Lag
Capacity tightens first. Spot rates move next. Contract rates follow 60–120 days later. The Barometer detects Step 1 before the market prices in Step 3.
Below 50 — Tightening capacity · rising procurement risk · upward pressure on contract rates
Above 50 — Loosening capacity · improving availability · downward pressure on contract rates
↑ Back to top

The Beagl Barometer™ is a proprietary capacity regime detection model. Readings are derived from publicly available freight market data and proprietary logistic regression analysis. For informational purposes and internal pricing team use only. Past regime behavior is not indicative of future market outcomes. © 2026 Beagl. All rights reserved.