
Monthly Market Intelligence
A logistic-regression–based capacity regime detection model that identifies freight market inflection points before they show up in rates.
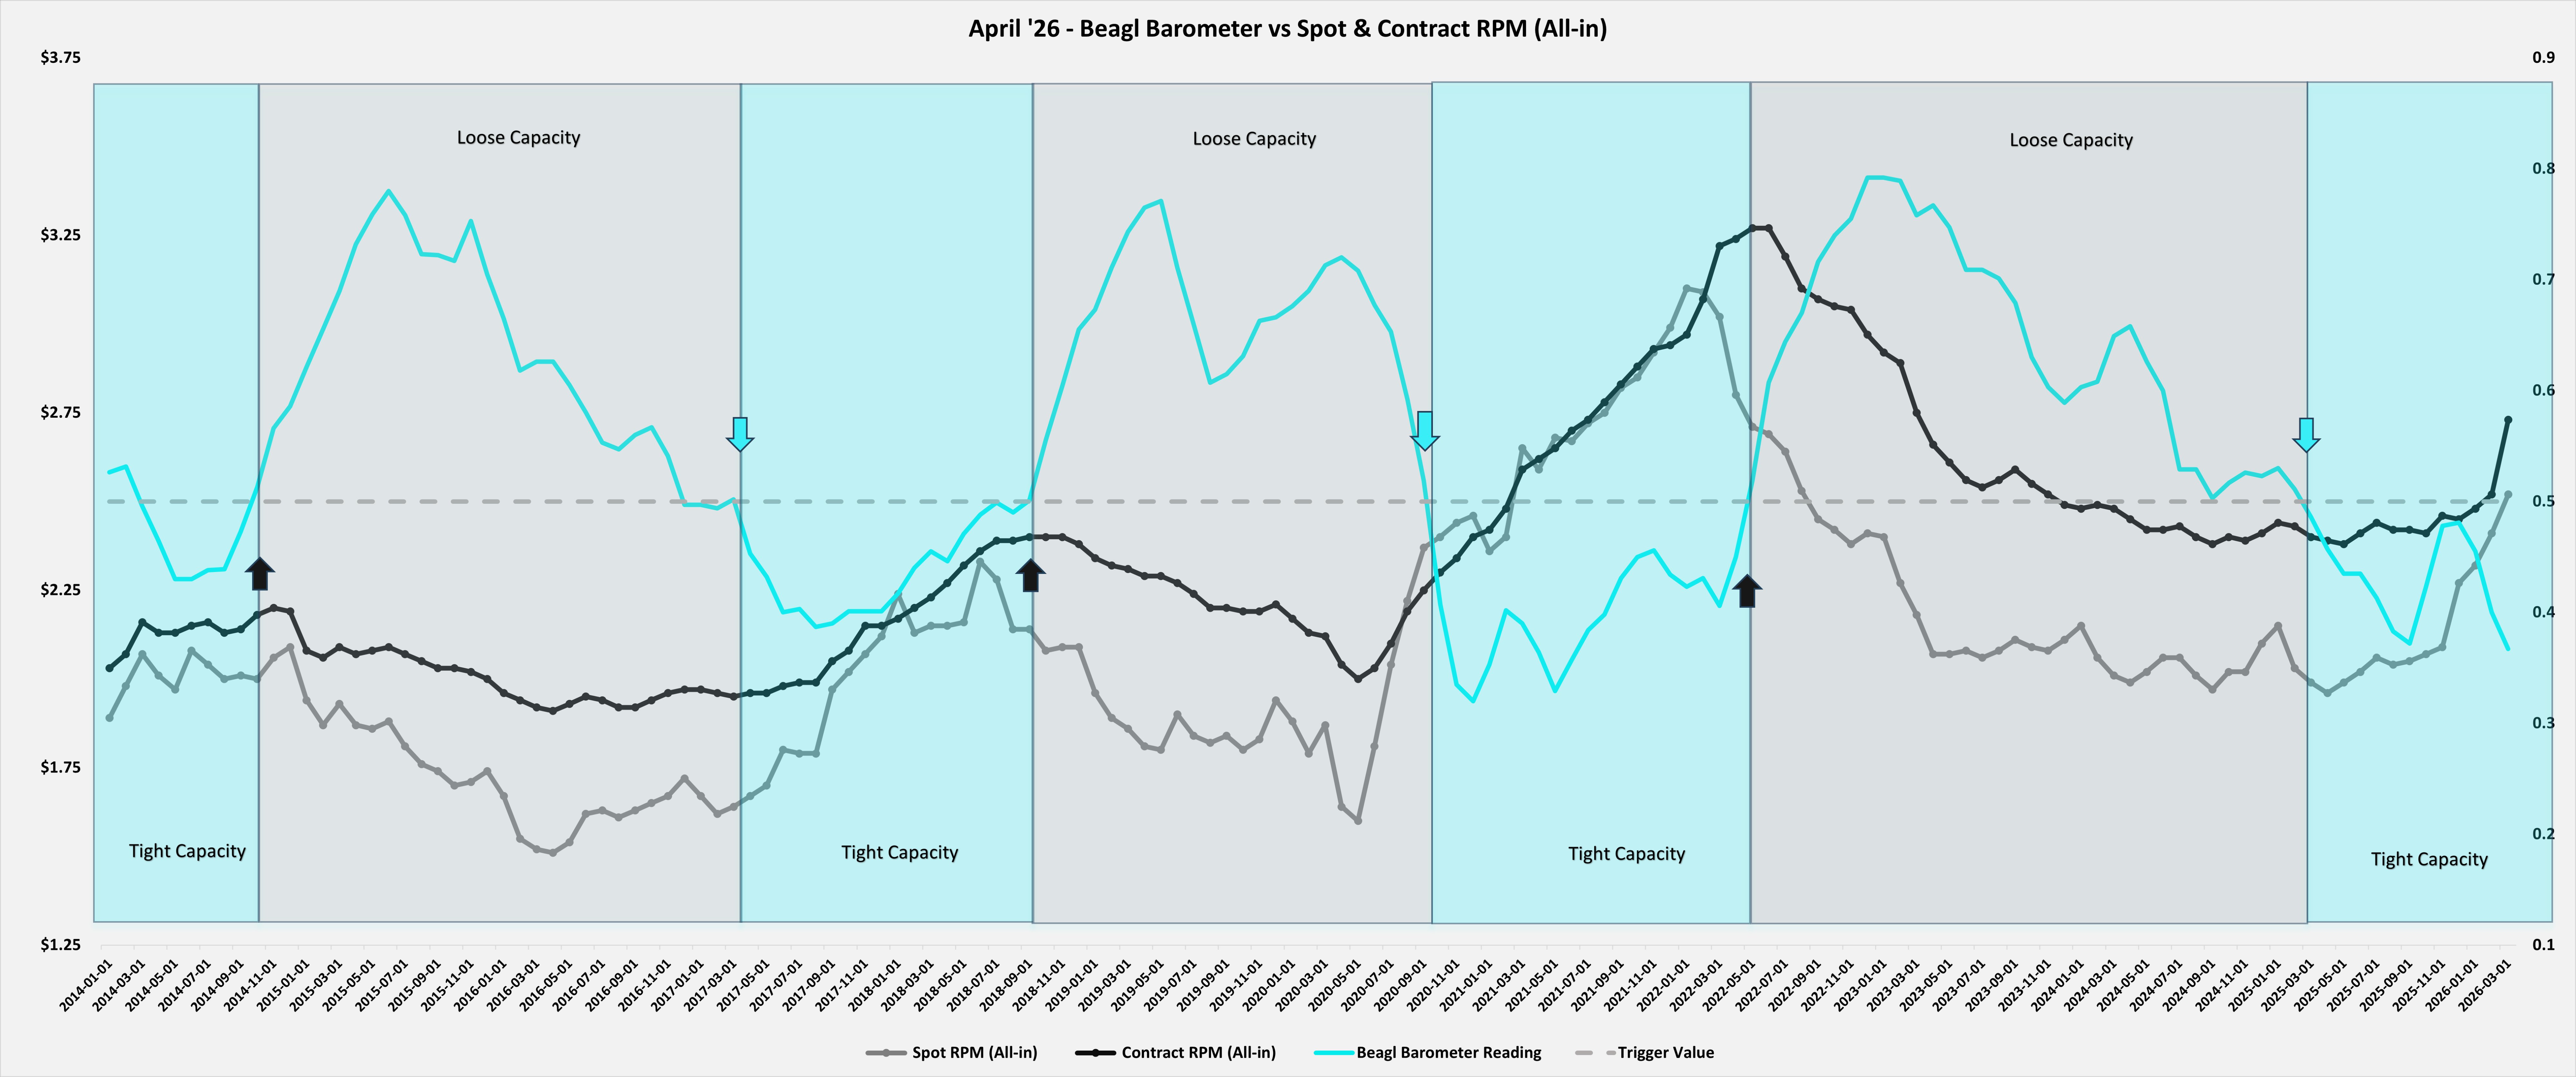
How the Barometer Works ↓The Beagl Barometer is a logistic-regression–based capacity regime detection model designed to identify inflection points in the freight market before they show up in rates. It continuously analyzes market structure and pricing behavior, assigning a normalized reading from 0–100 with a critical trigger value of 50 separating tight and loose capacity regimes.
| All employees, truck transportation | Tight |
| Active FMCSA Class 8 registrations | Tight |
| Class 8 net orders | Neutral |
| Real personal consumption expenditures | Neutral |
| Industrial production, manufacturing | Slightly tight |
| Merchant wholesaler sales | Slightly tight |
| Inventory to sales ratio | Tight |
| Truck tonnage index | Tight |
| DAT load to truck ratio | Slightly tight |
| SONAR OTRI | Tight |
| ATRI operating cost vs spot rates | Slightly tight |
| Dry van contract to spot premium | Tight |
The Beagl Barometer remained below its 50-point trigger threshold in April 2026, registering a reading of 25, and falling to its lowest level since June of 2021. The Barometer crossed over its trigger a year ago in April 2025 predicting the well-recognized tight capacity regime months before the market realized that the supply-driven freight rate recovery was underway. It is worthy to note that Dry Van Spot rates also registered their lowest reading of the deflationary cycle in the same month. The Beagl Barometer called the low.
The signal is driven primarily by recovery in Demand and continued tightness in Leading Indicator sub-indices, both registering well into tightening territory. Active FMCSA Registrations and All Employees, Truck Transportation have declined meaningfully from their 2024 peak despite a recovery in Class 8 net orders which have started the year off strong as fleets are replacing ageing equipment, a welcome shift that should improve Carrier OOS levels for equipment safety violations.
The leading indicators are the most acute: DAT Load-to-Truck ratios improved in April but remain elevated, SONAR’s OTRI is continuing to hold near cycle highs, and the Contract-to-Spot premium is compressing. We are starting to see significant contract resets as broker margins cannot sustain the ongoing margin compression.
The Beagl Barometer™ is a proprietary capacity regime detection model. Readings are derived from publicly available freight market data and proprietary logistic regression analysis. For informational purposes and internal pricing team use only. Past regime behavior is not indicative of future market outcomes. © 2026 Beagl. All rights reserved.